
Troubleshoot AWS Reachability Issues with VPC Flow Logs


In this article, we will introduce one of the most useful tools that every engineer responsible for the network layer should have in their arsenal: VPC flow logs.
Back in the day when private data centers were cool, when we needed to troubleshoot network problems, we had to “tap the wire” and that could take many forms such as installing packet sniffers on various network segments or configuring complicated traffic mirroring options. Enter VPC flow logs! With the cloud and the advent of software defined networks, troubleshooting IP networks has never been easier.
Flow logs give you the ability to listen to the network traffic at very precise points in your VPC and capture these insights in CloudWatch. Or you might elect to listen to the entire traffic for the whole VPC. The three scoping options are:
So which approach should you use? Well, that depends on how far you have gone in your troubleshooting. For example, if you already isolated the problem to a specific instance, it makes sense to listen specifically to the traffic belonging to the network interface(s) of that instance. If you suspect a broader network issue but are not too sure where to start, you may want to capture the whole VPC traffic at the expense of also capturing “noise” that will undoubtedly make it harder to pinpoint the problem.
VPC flow logs do not capture the actual payload of your IP packets, rather they capture a lot of metadata such as source and destination ports, addresses, number of bytes transferred and very interestingly for us, an action. And that action field can take one of two values: “ACCEPT” and “REJECT”.
A packet can be rejected for mainly three reasons: A security group is getting in the way, an Access Control List (ACL) is getting in the way, or a TCP packet has arrived after the connection was closed. This proves an invaluable troubleshooting tool.
In the example below, we have a VPC with a single public subnet in which lives a web server. It has been reported that after the network maintenance that took place the previous week, the web server is no longer reachable from the internet. Let’s dive in!
Before we take on this networking challenge, we need to create an IAM role. This role will be used a little bit later and all it does is give permissions to the VPC flow logs servers to write in CloudWatch.
In your IAM window, create a new EC2 role called vpc-flowlogs (check the AWS service and EC2 radio buttons) and create a policy called vpc-flowlogs-to-cloudwatch.
Update the JSON as follows:
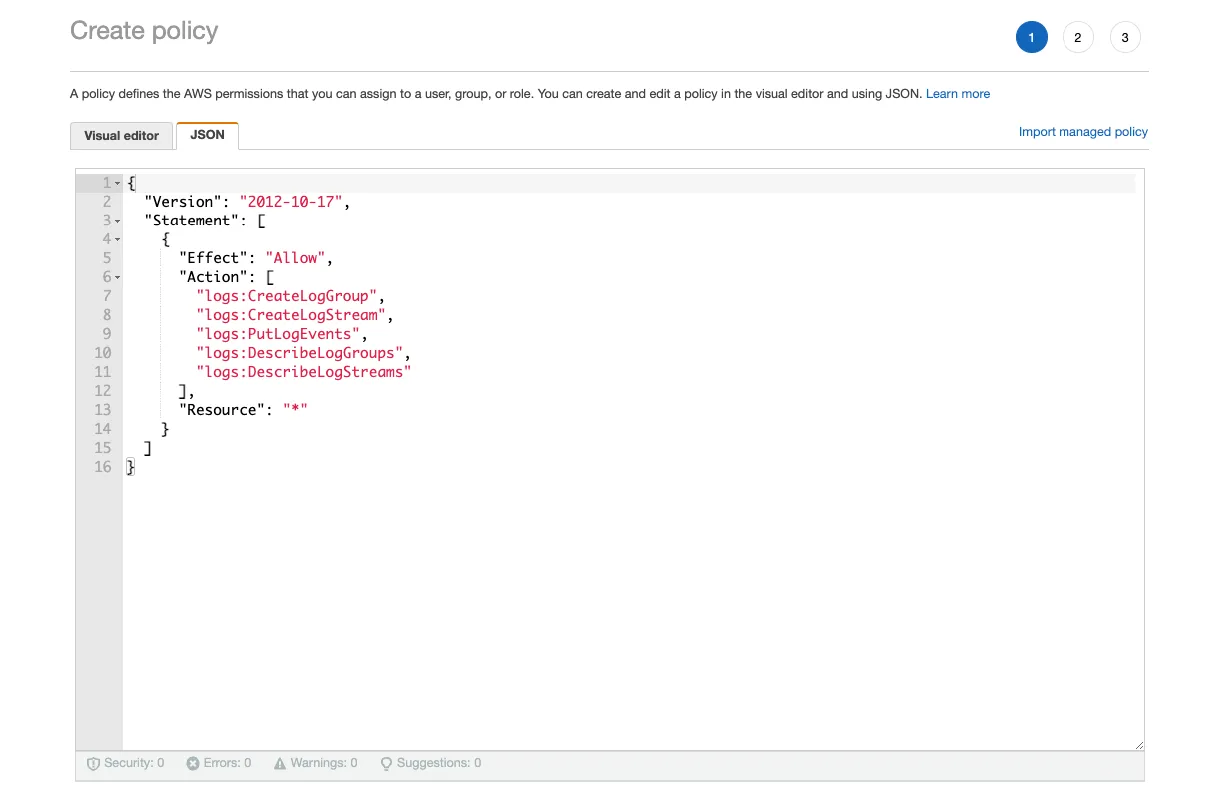
Finally, update the Trust relationships of this role so that it reflects the below:

That's it for the prerequisites and without further ado, let’s move on to the VPC flow logs.
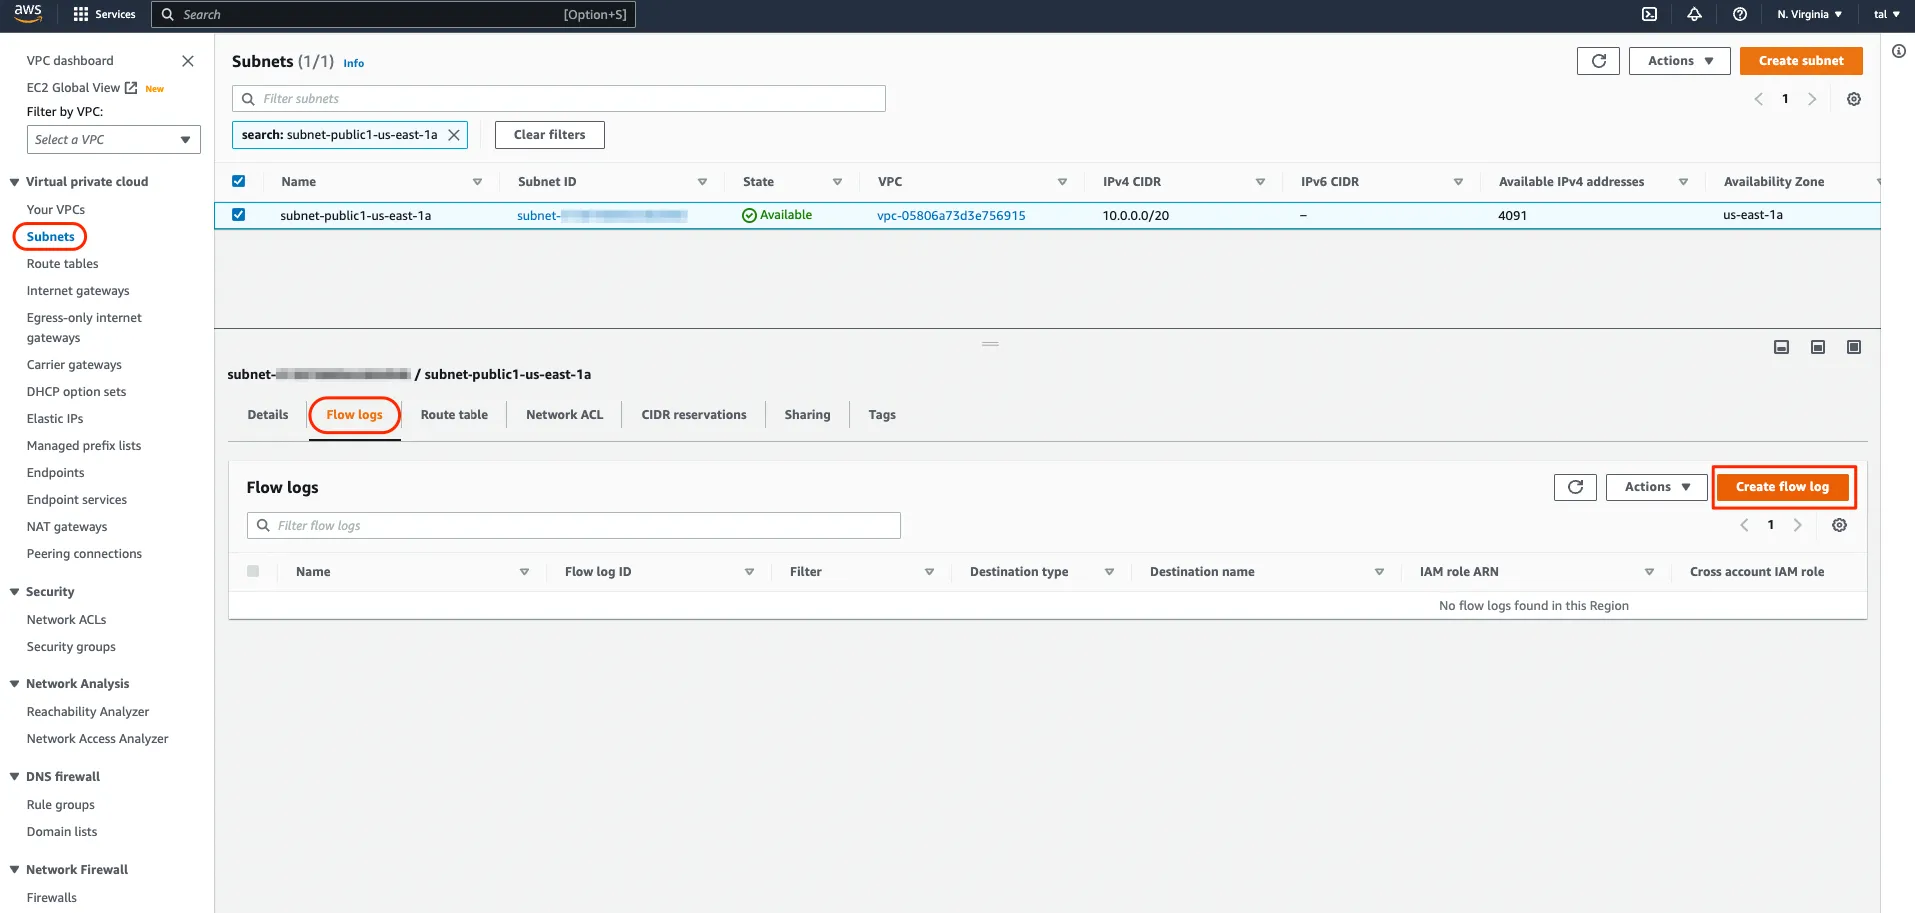
We explained earlier that VPC flow logs can be enabled at various points in your VPC. In our case, we suspected that something might be wrong with our web server, so we could enable VPC flow logs at that server network interface level. However, in a production scenario it would not be uncommon to have your web traffic served by a fleet of servers in the same subnet. For that reason, we will go ahead and enable VPC flow logs at the subnet level.
In the VPC console, select your subnet, navigate to the Flow logs tab, and click “Create flow log”
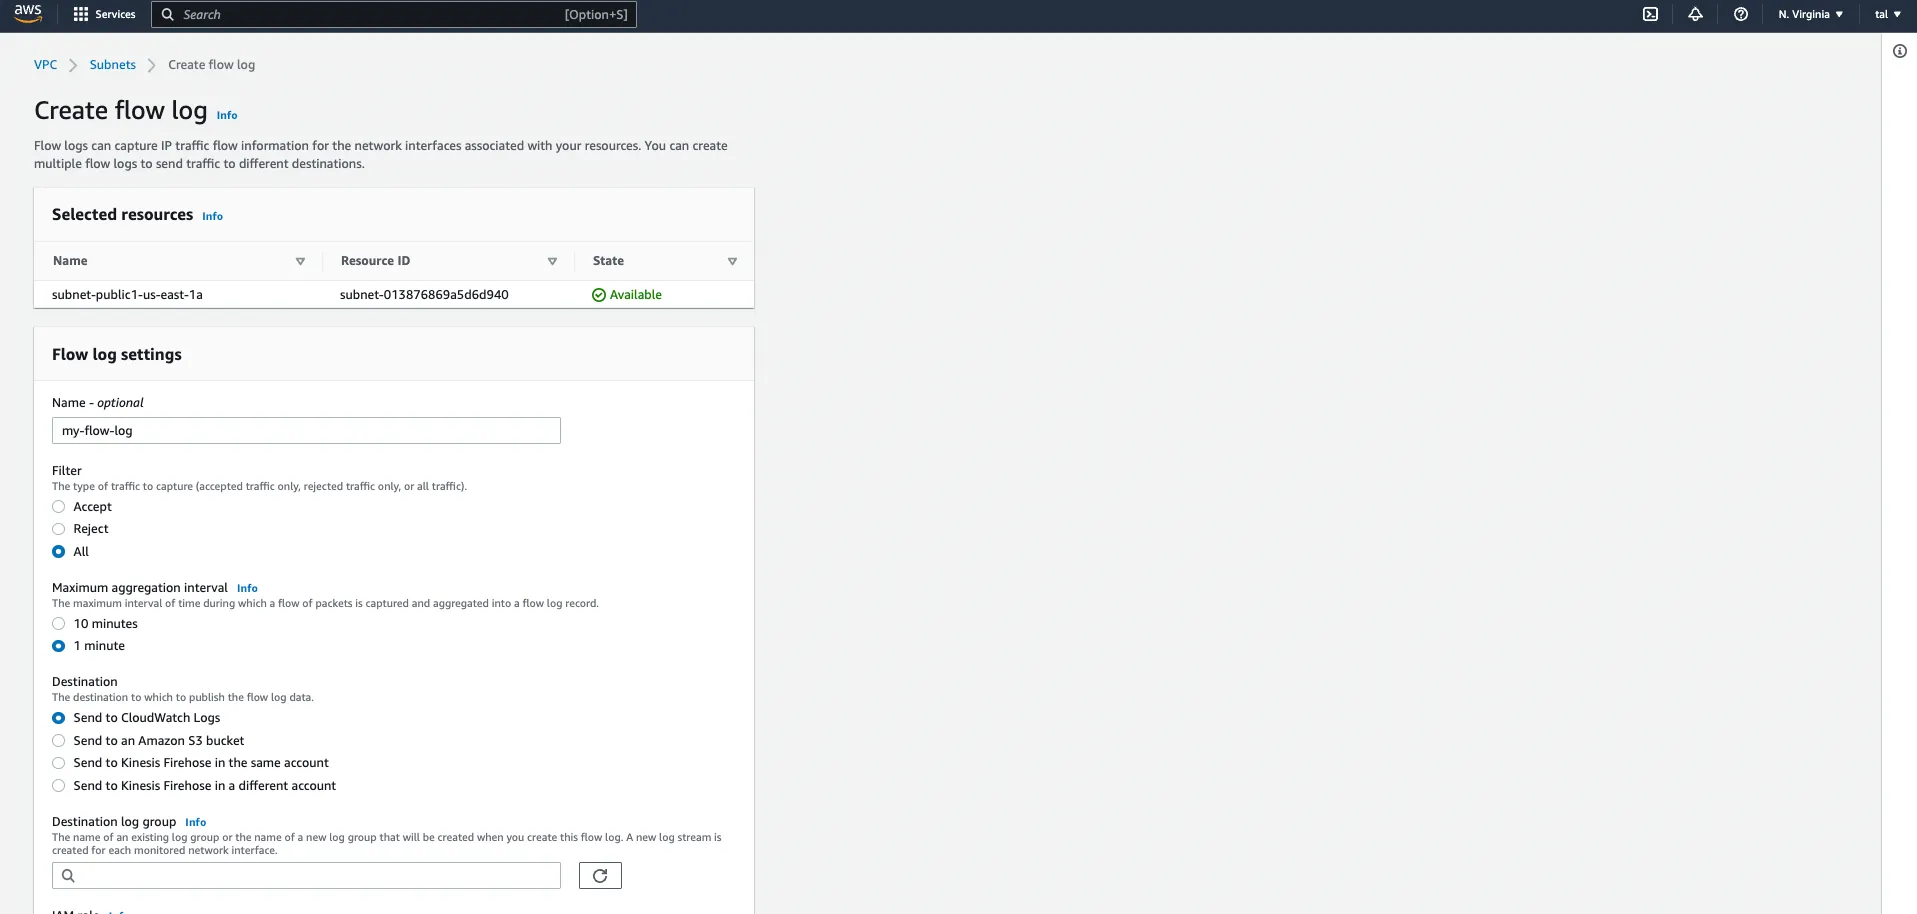
We give our flow logs a name and we set it up so that it captures all the traffic in our web subnet, both accepted and rejected traffic. We specify a 1-minute aggregation period and ask that the logs be streamed to CloudWatch logs. If you type a new name for the destination log group, it will be created in CloudWatch logs for you so no need to visit CloudWatch logs during the prerequisite phase. Finally, we specify the IAM role we created earlier and leave all the other settings untouched.
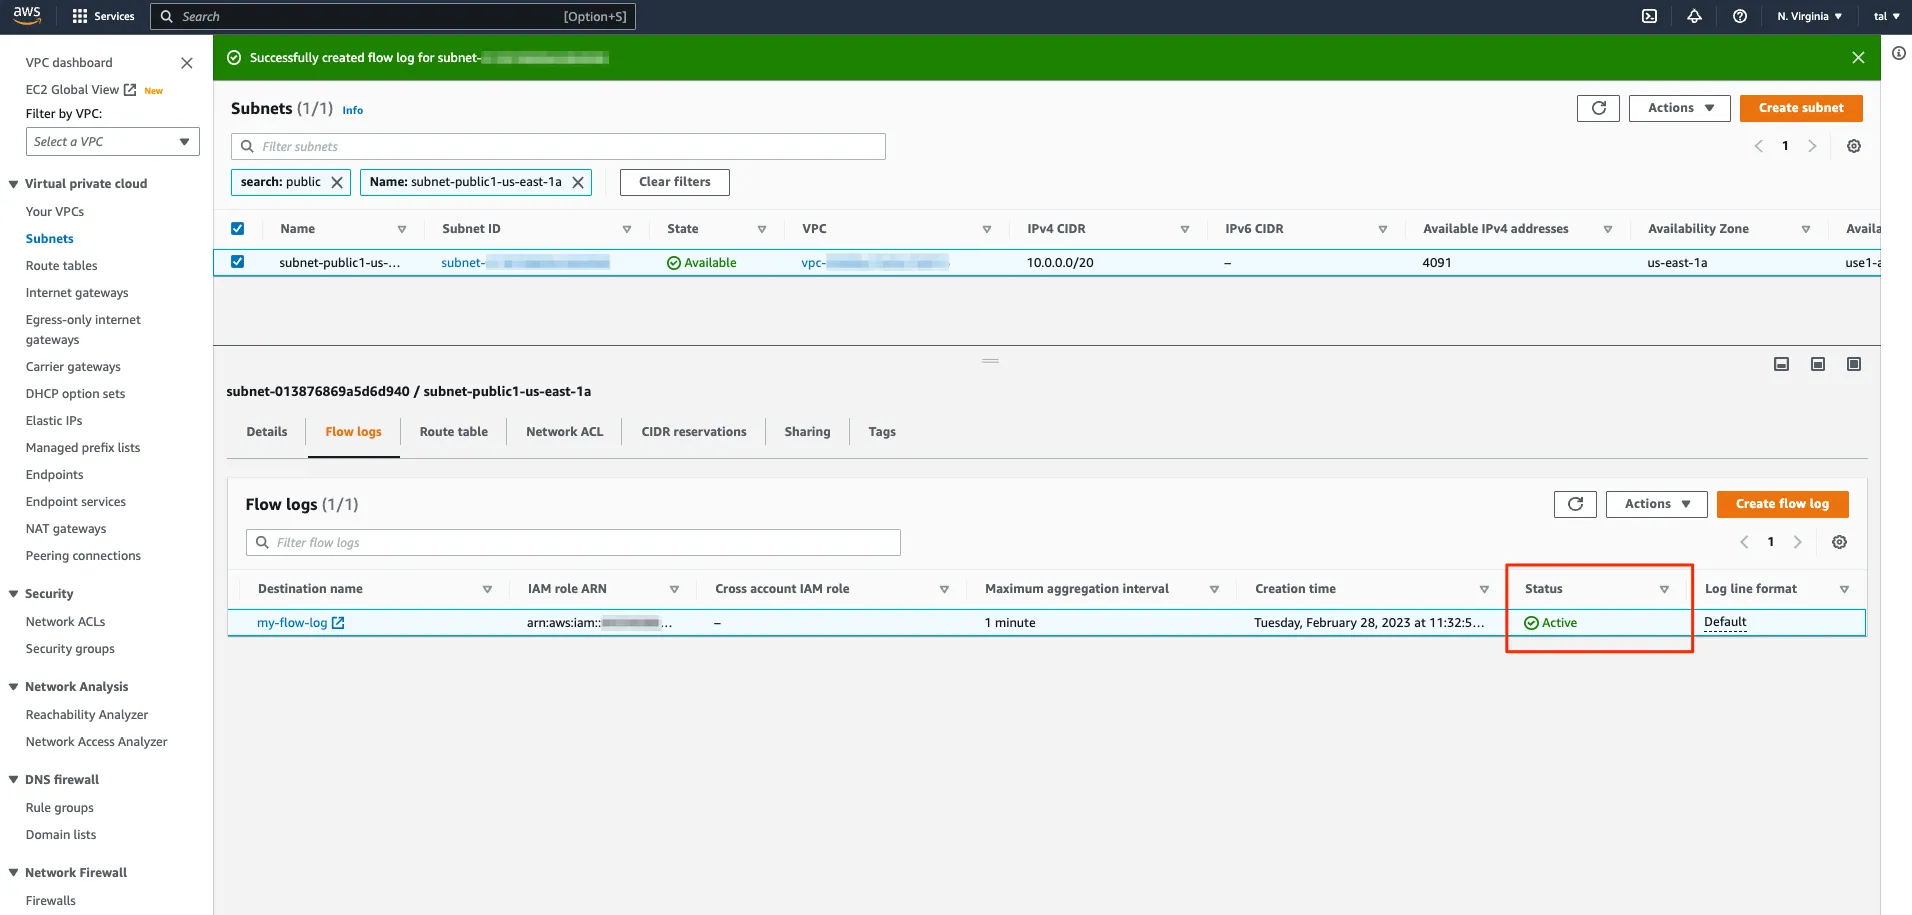
If you created the IAM role properly, your VPC flow logs should show as Active:
Let’s be sure to send some traffic to our web server from our web browser and let’s go pay CloudWatch logs a visit!
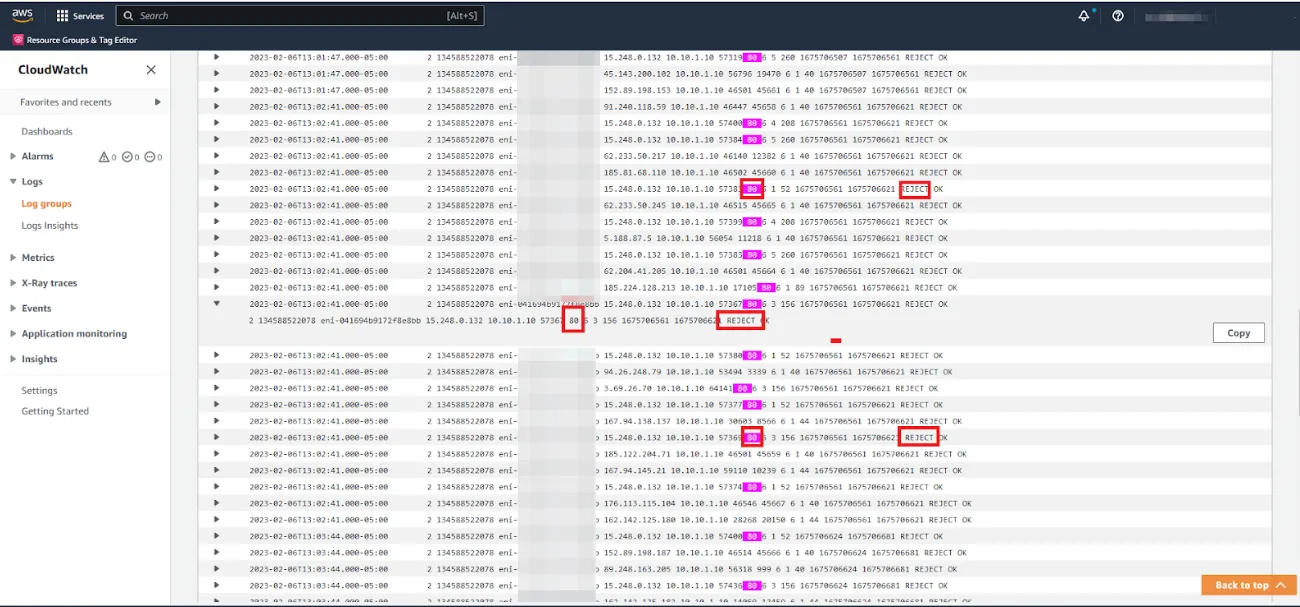
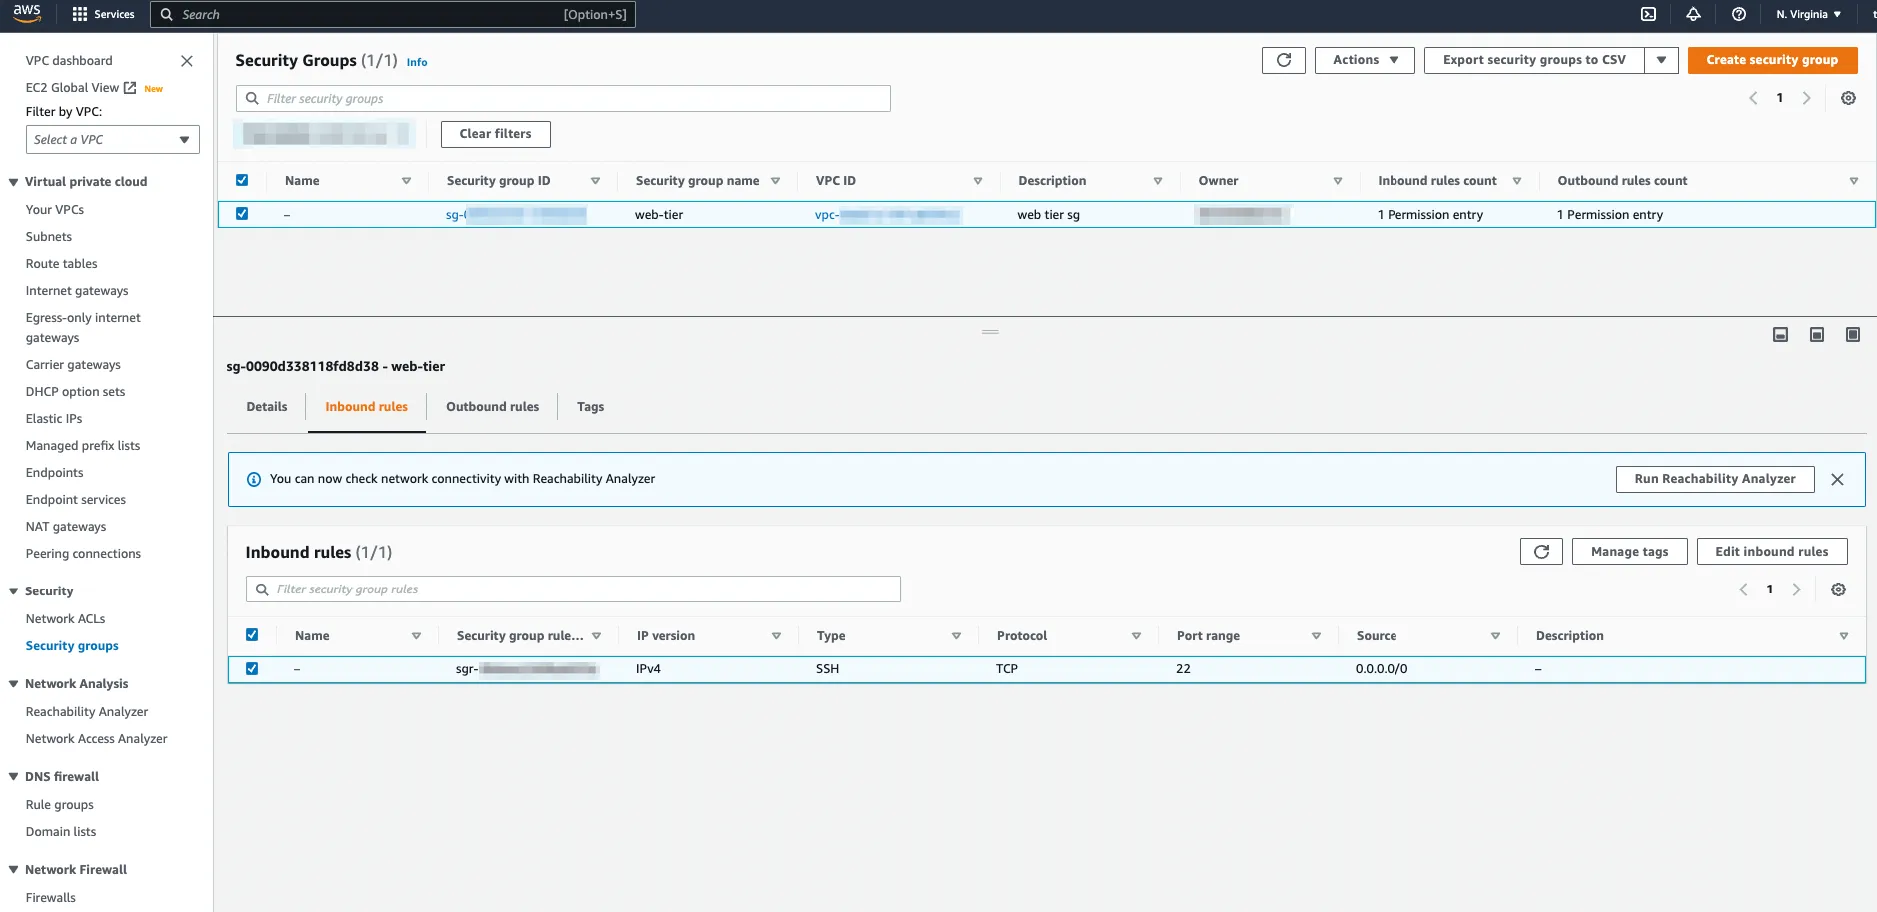
And surely enough, upon checking the security group, it appears that it allowed SSH traffic inbound but mistakenly did not allow web traffic (HTTP).
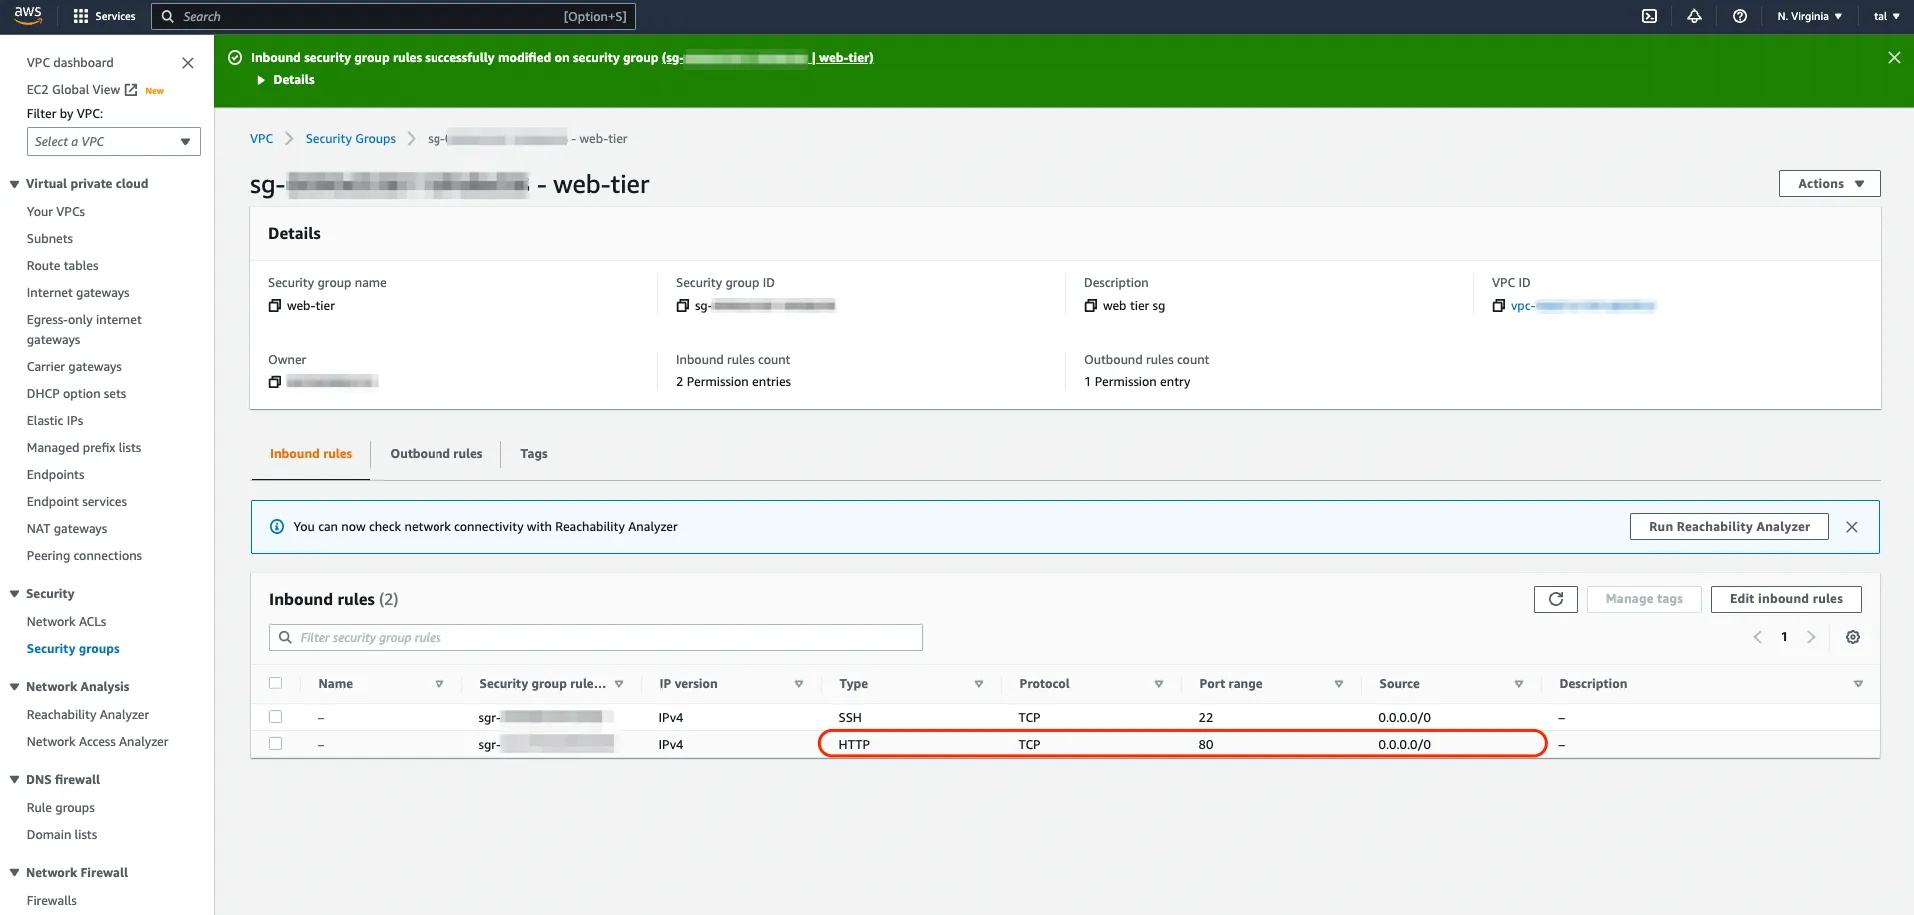
Adding another rule to allow HTTP inbound on port 80 solves the issue and the web server is accessible again! And note that in CIDR notation for IPv4, if you want your server to be reachable from any IP address, internal or external, you specify a subnet mask of “slash zero” (/0).
If your VPC flow logs indicate that the packets are being rejected but after checking your VPC Security Groups, you cannot identify a configuration problem, remember the second most common reason for a “REJECT” and that is the Network Access List. You will find those in the VPC console because as you might have guessed, they operate at network level. The subnet level to be more precise. In our case here, we want to make sure that we have both inbound rules and outbound rules to allow our web traffic into the web servers and the return traffic back to the client. Yes, unlike Security Groups, Network Access Lists are stateless. The fact that traffic is allowed in doesn’t not necessarily mean that the return traffic will be allowed out.

For example, the rule above ensures that all traffic is allowed into our subnet. And Conversely, this rule below ensures that all traffic, and more importantly to us, the return traffic back to the web client, is allowed out.

Stream Security's Network Traffic Activity logs helps you to troubleshoot and identify network traffic issues faster with a complete context of your cloud environment, using near real-time enriched VPC flow logs. Stream Security enriches VPC flow logs, allowing for the capture of information regarding IP traffic between network interfaces in your VPC. This information can include details such as source and destination IP addresses, port numbers, protocol, number of bytes and packets, and the flow's status (accepted or rejected).
Let’s see how in a quick few steps we can troubleshoot the same issue described above. The Network Traffic Activity logs can be filtered using various available filters to determine what actions were made, were accepted or rejected, what is the source and source IP address where the call came from, to which destination and through which ports and protocol, what was the traffic volume, and when the action was made, and so on.
The following image shows aggregated network traffic between the Internet and our web server by accepted and rejected traffic:
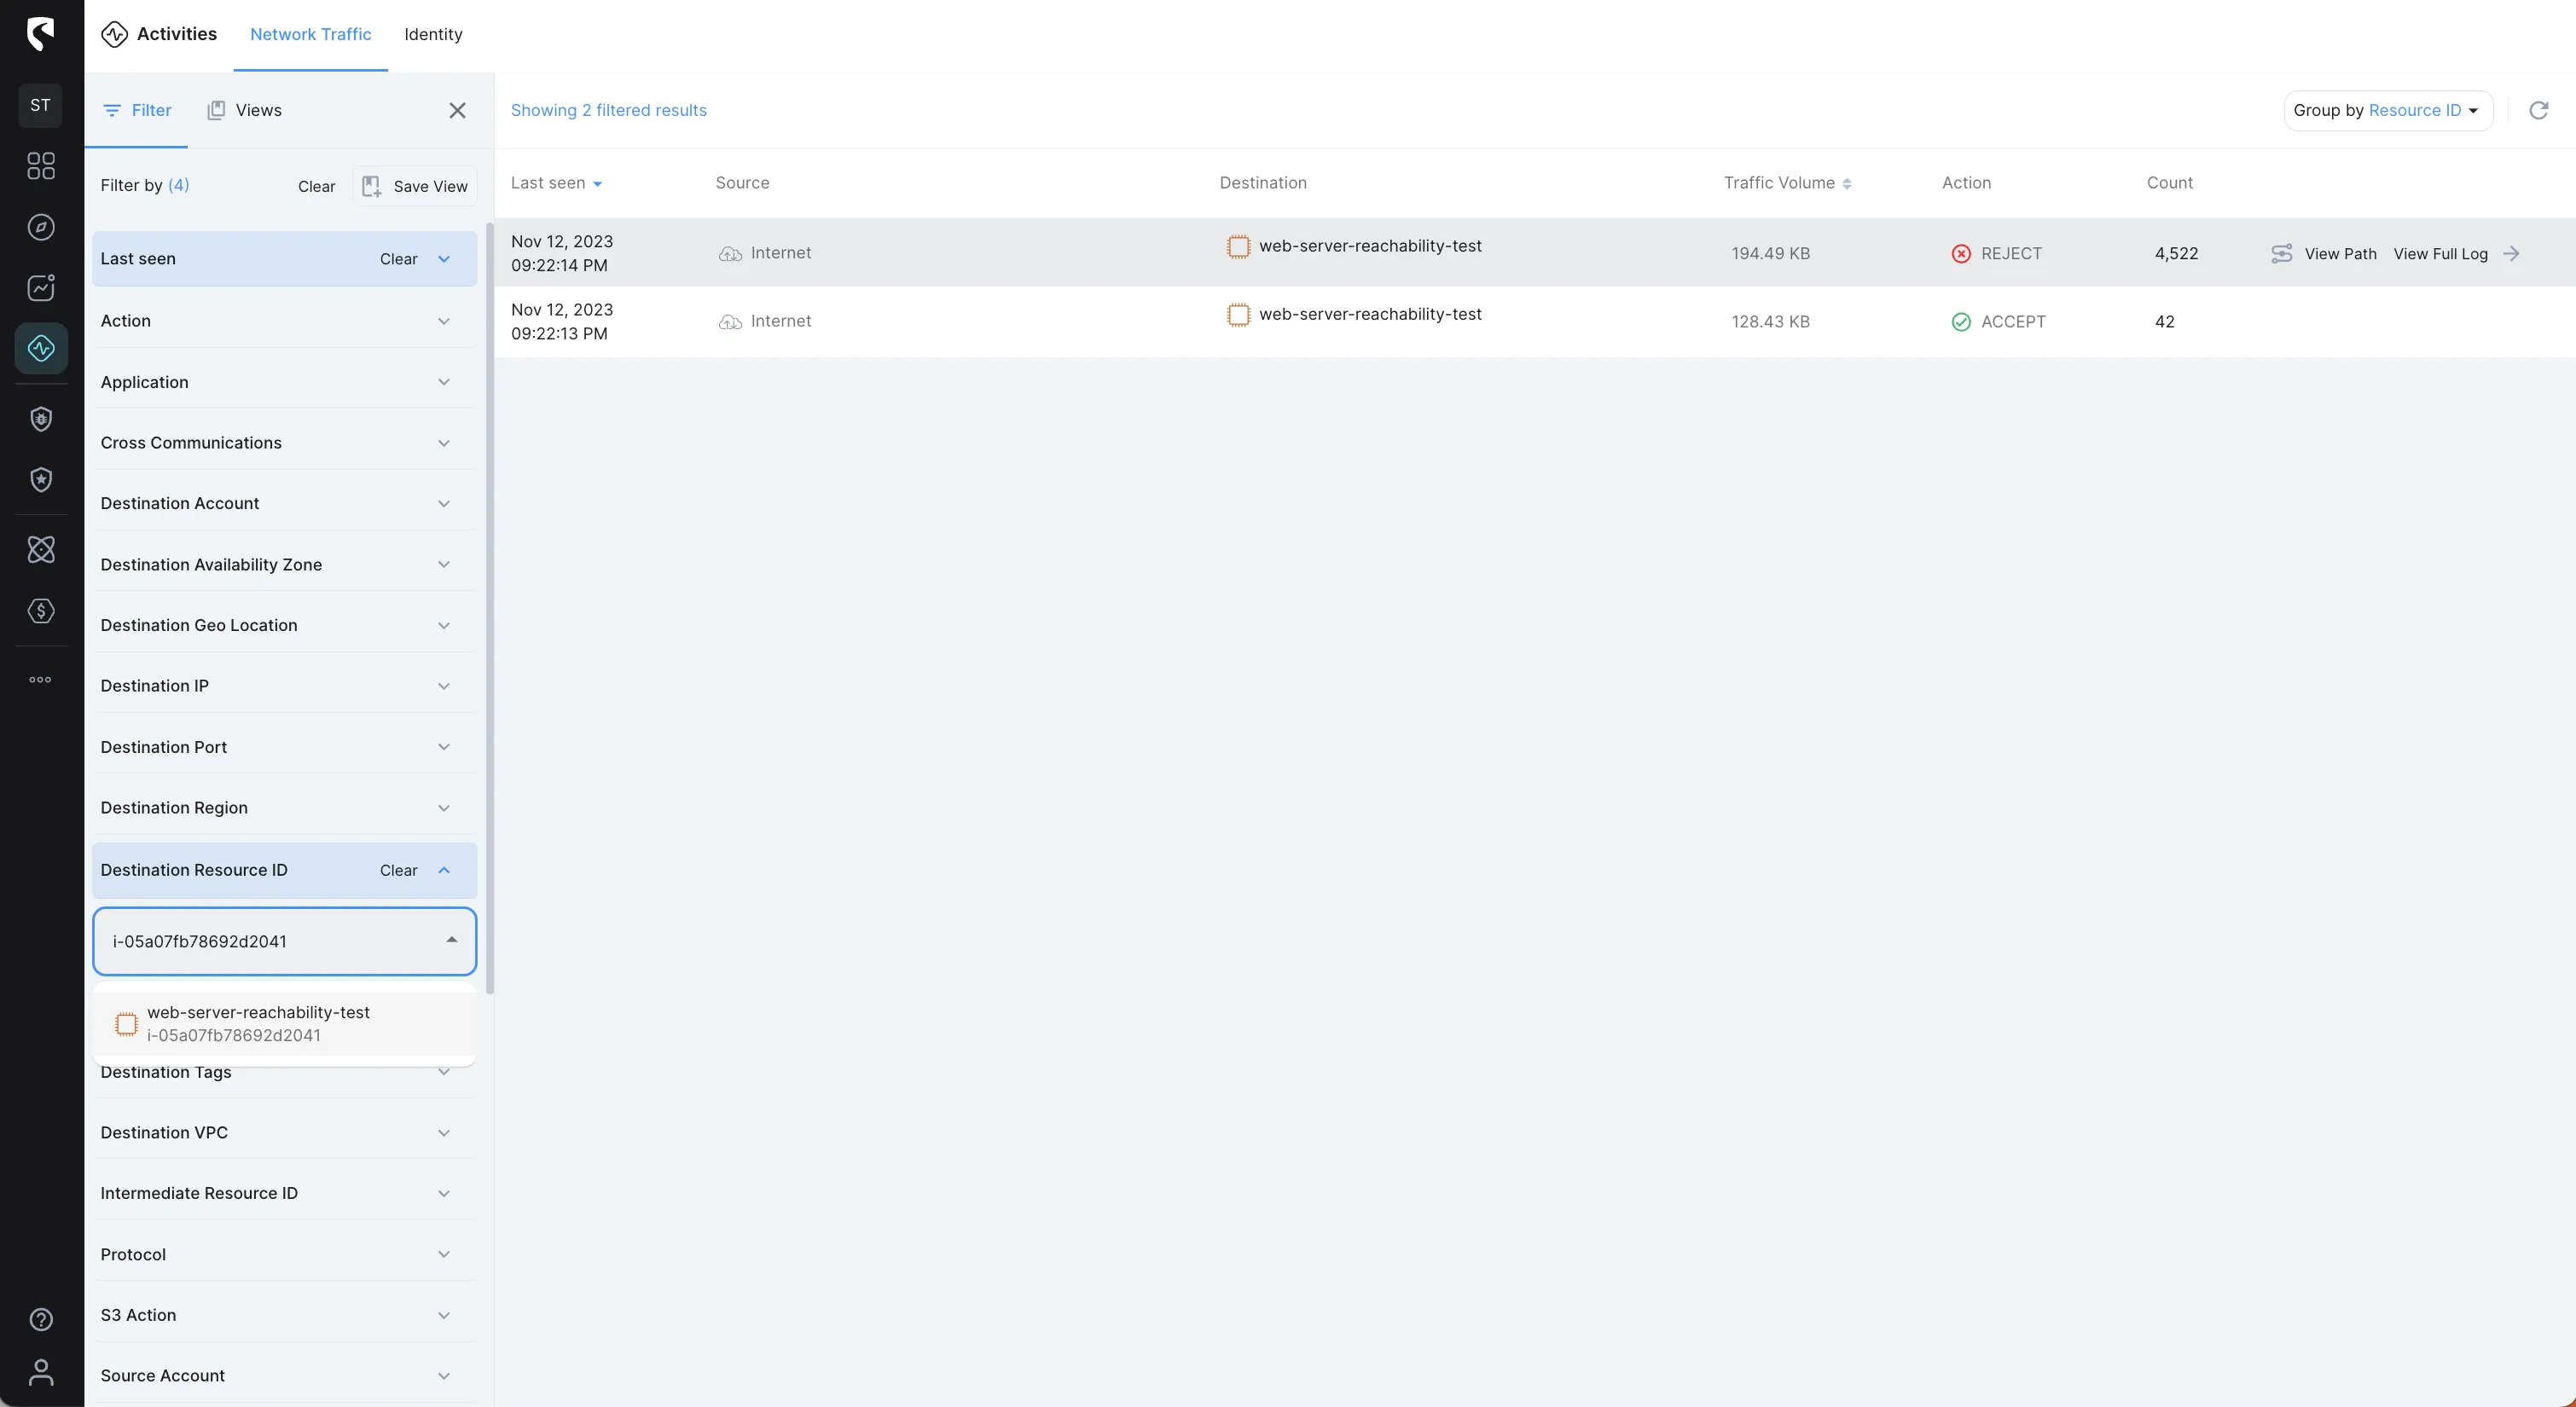
Since we’re debugging a networking issue to a web server, let’s filter Action of REJECT and the Destination Port of port 80 (HTTP)
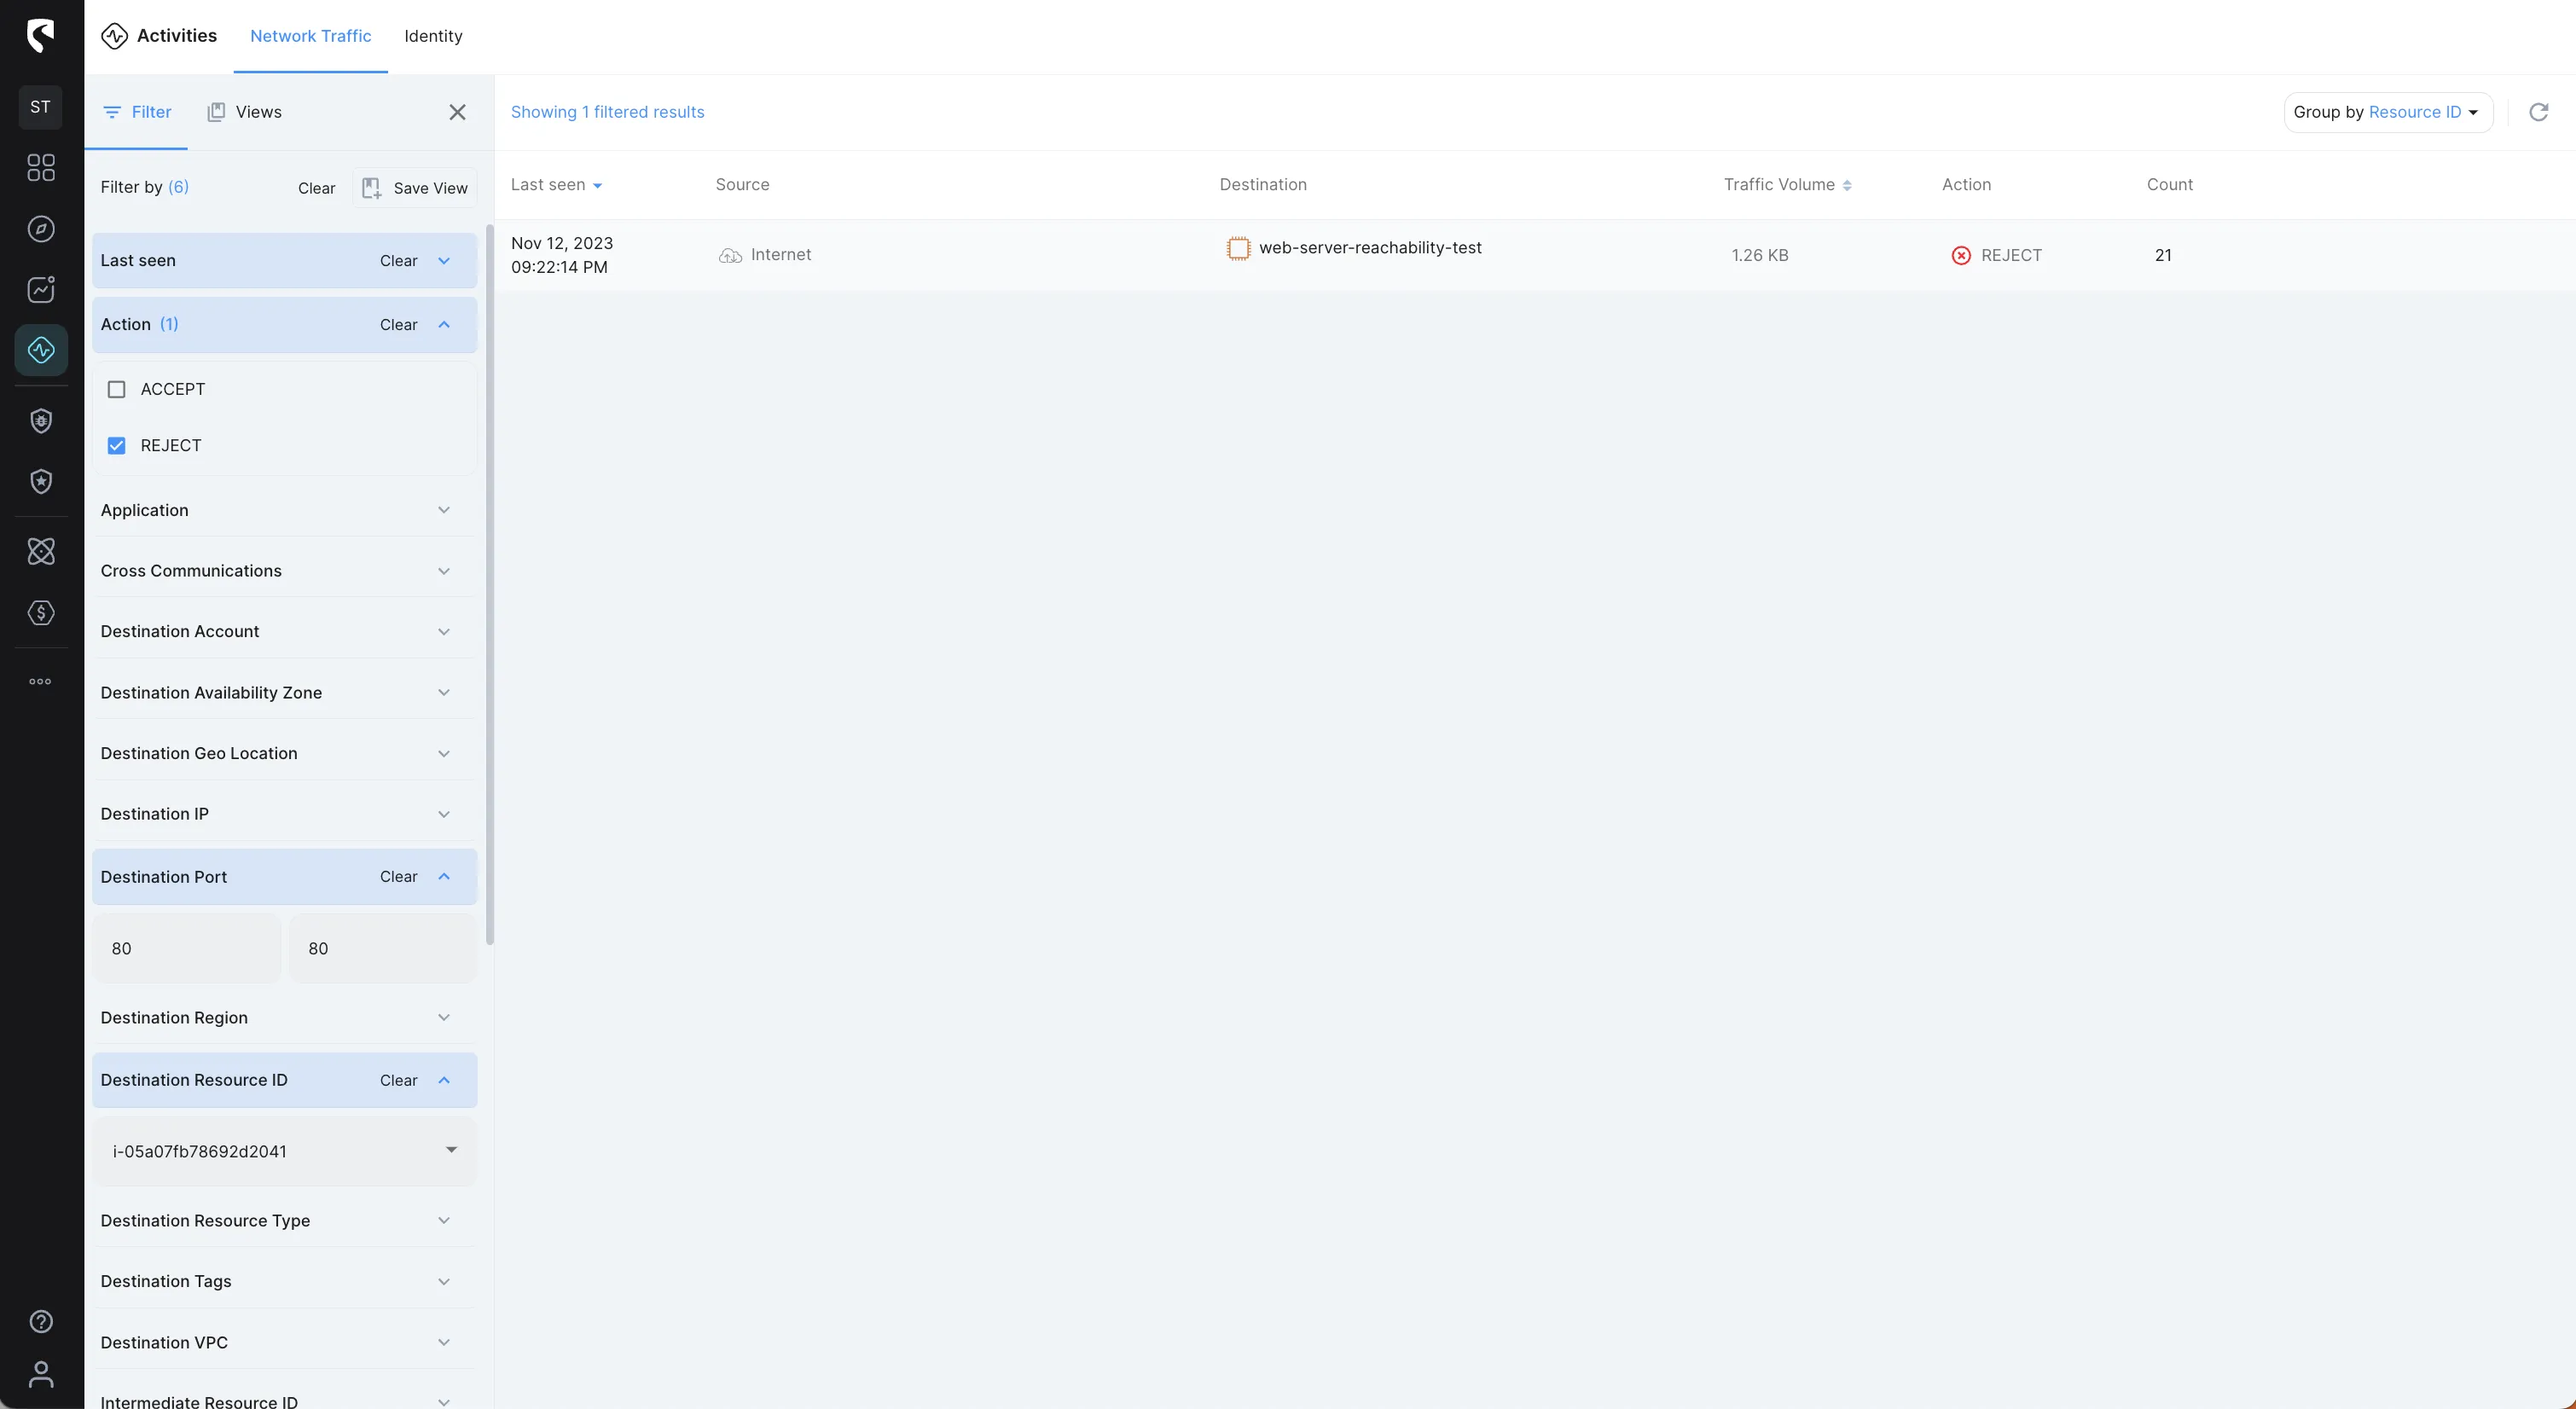
We can further investigate and see the “history” of the traffic to our web server and see if the issue started at some point or exists from the start, so let’s filter by all Action (ACCEPT & REJECT)
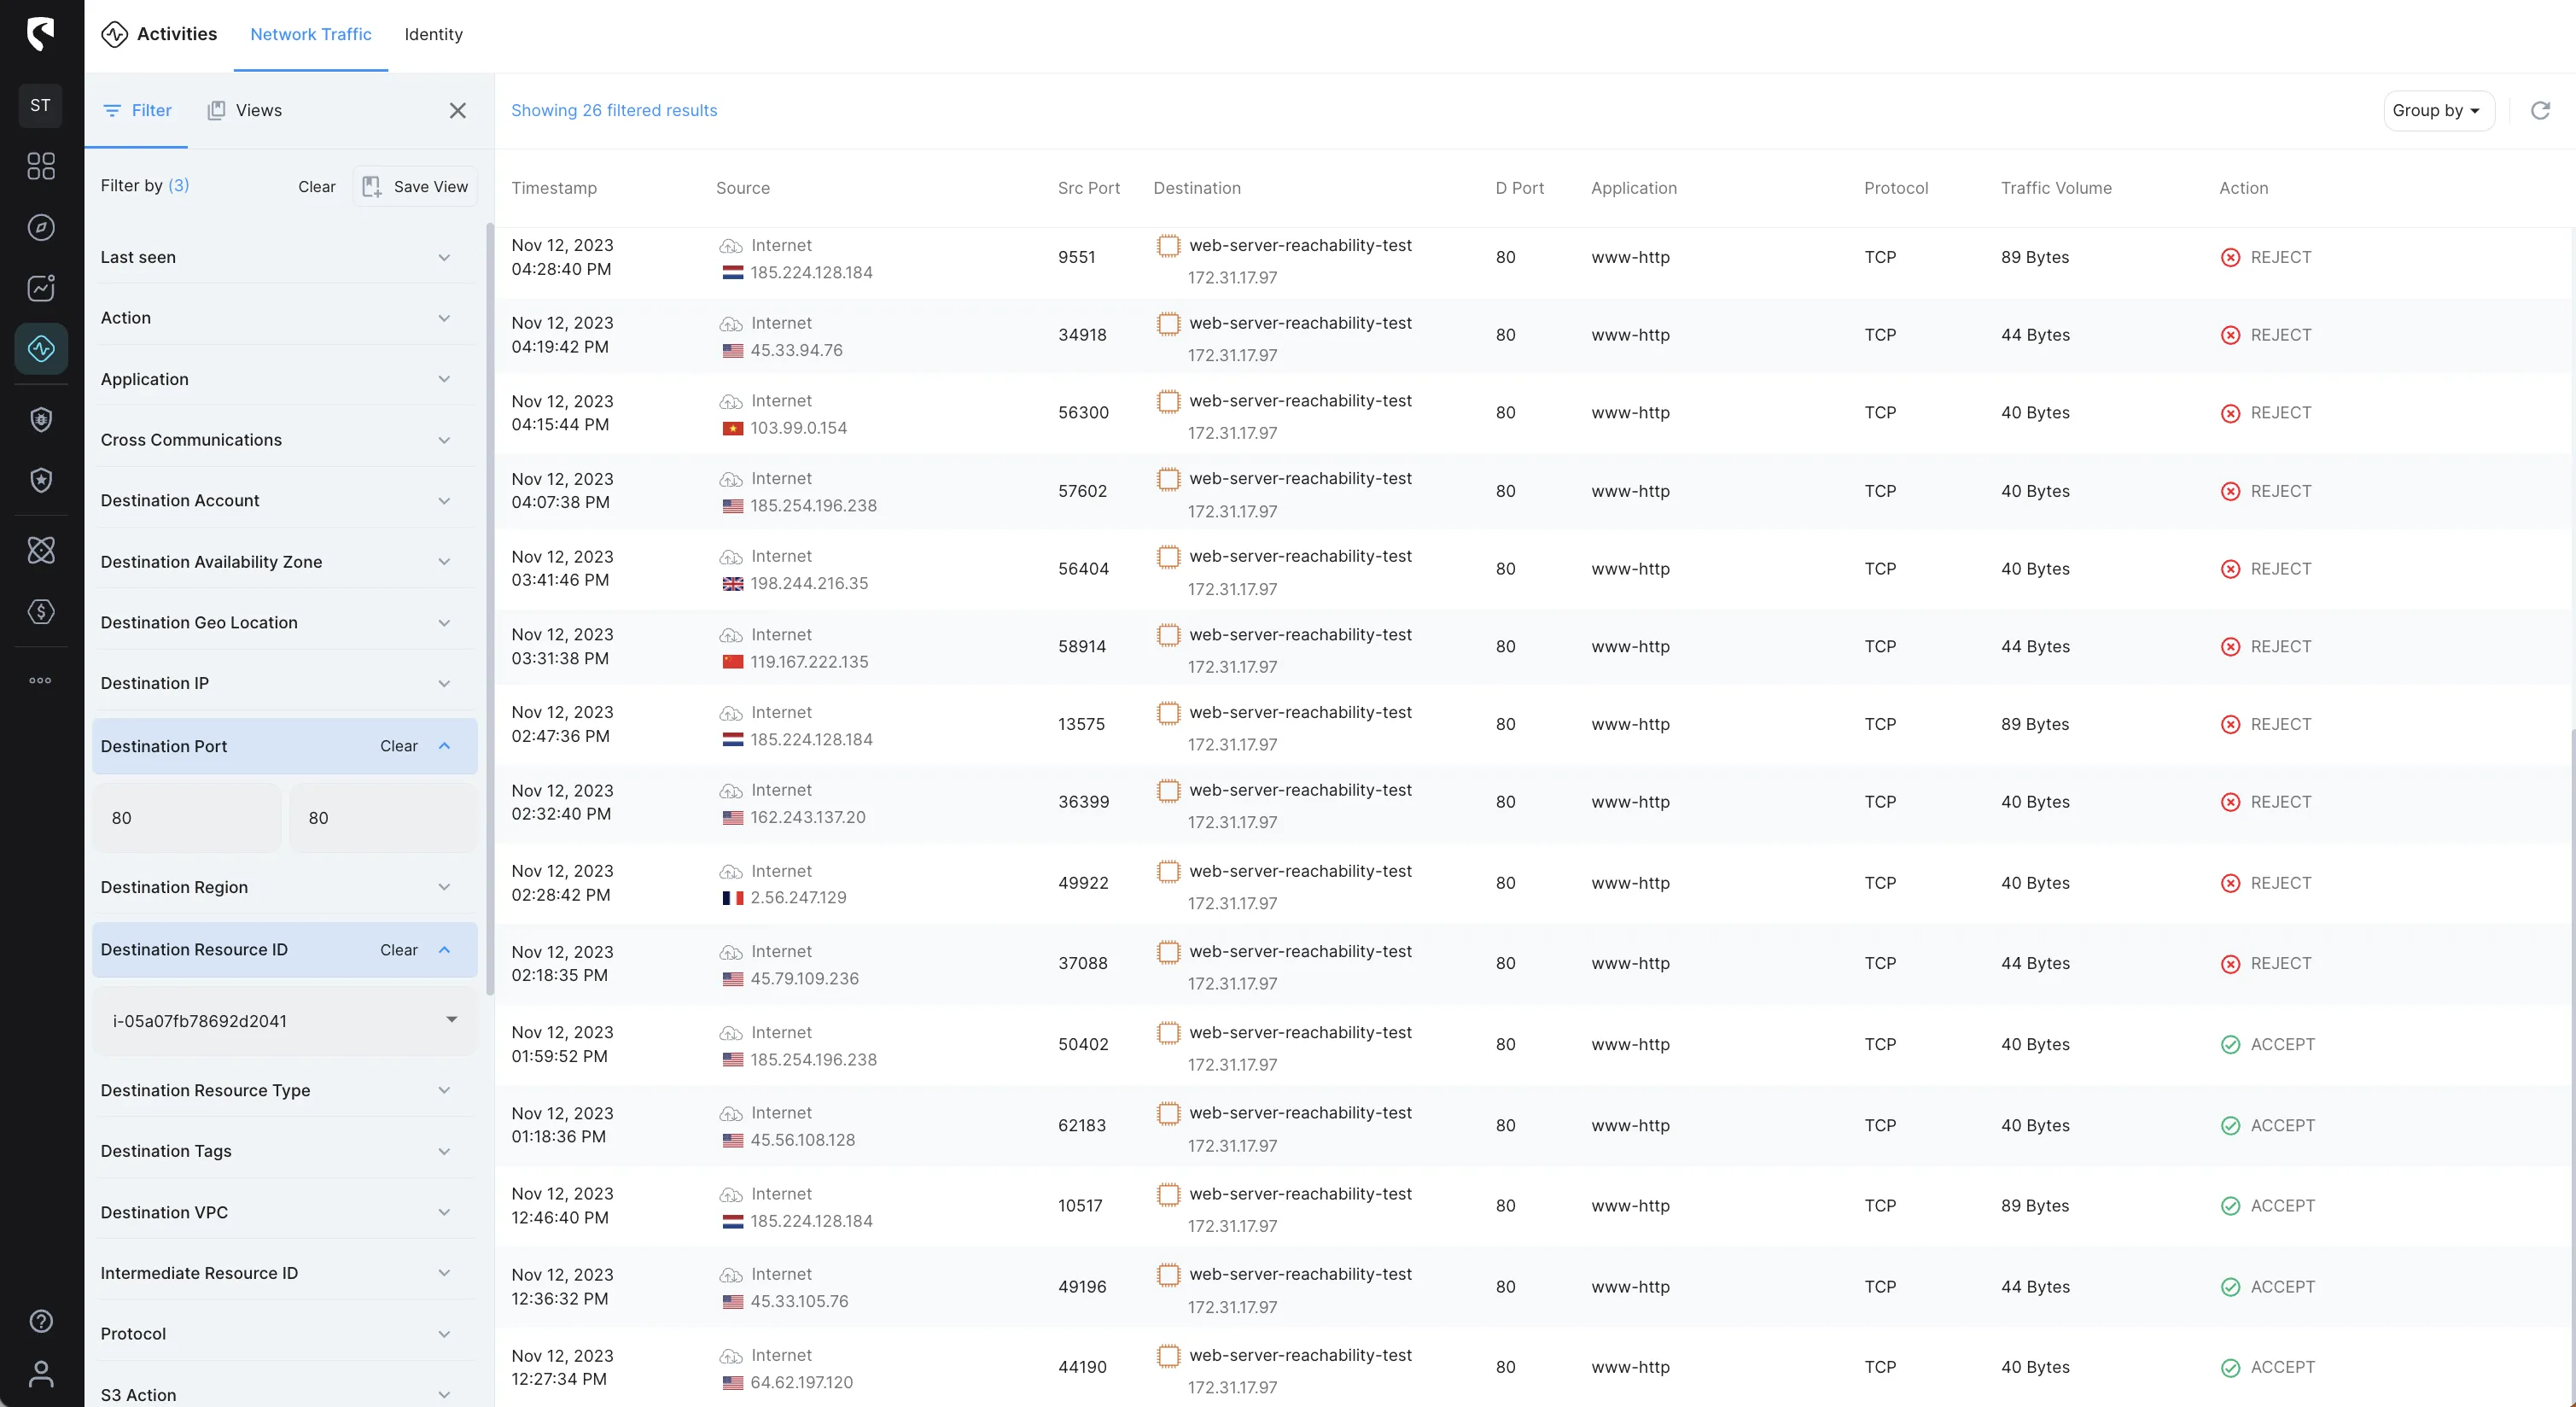
From the image above we can see that HTTP (Port 80) traffic was accepted as some point and then turned to rejected.
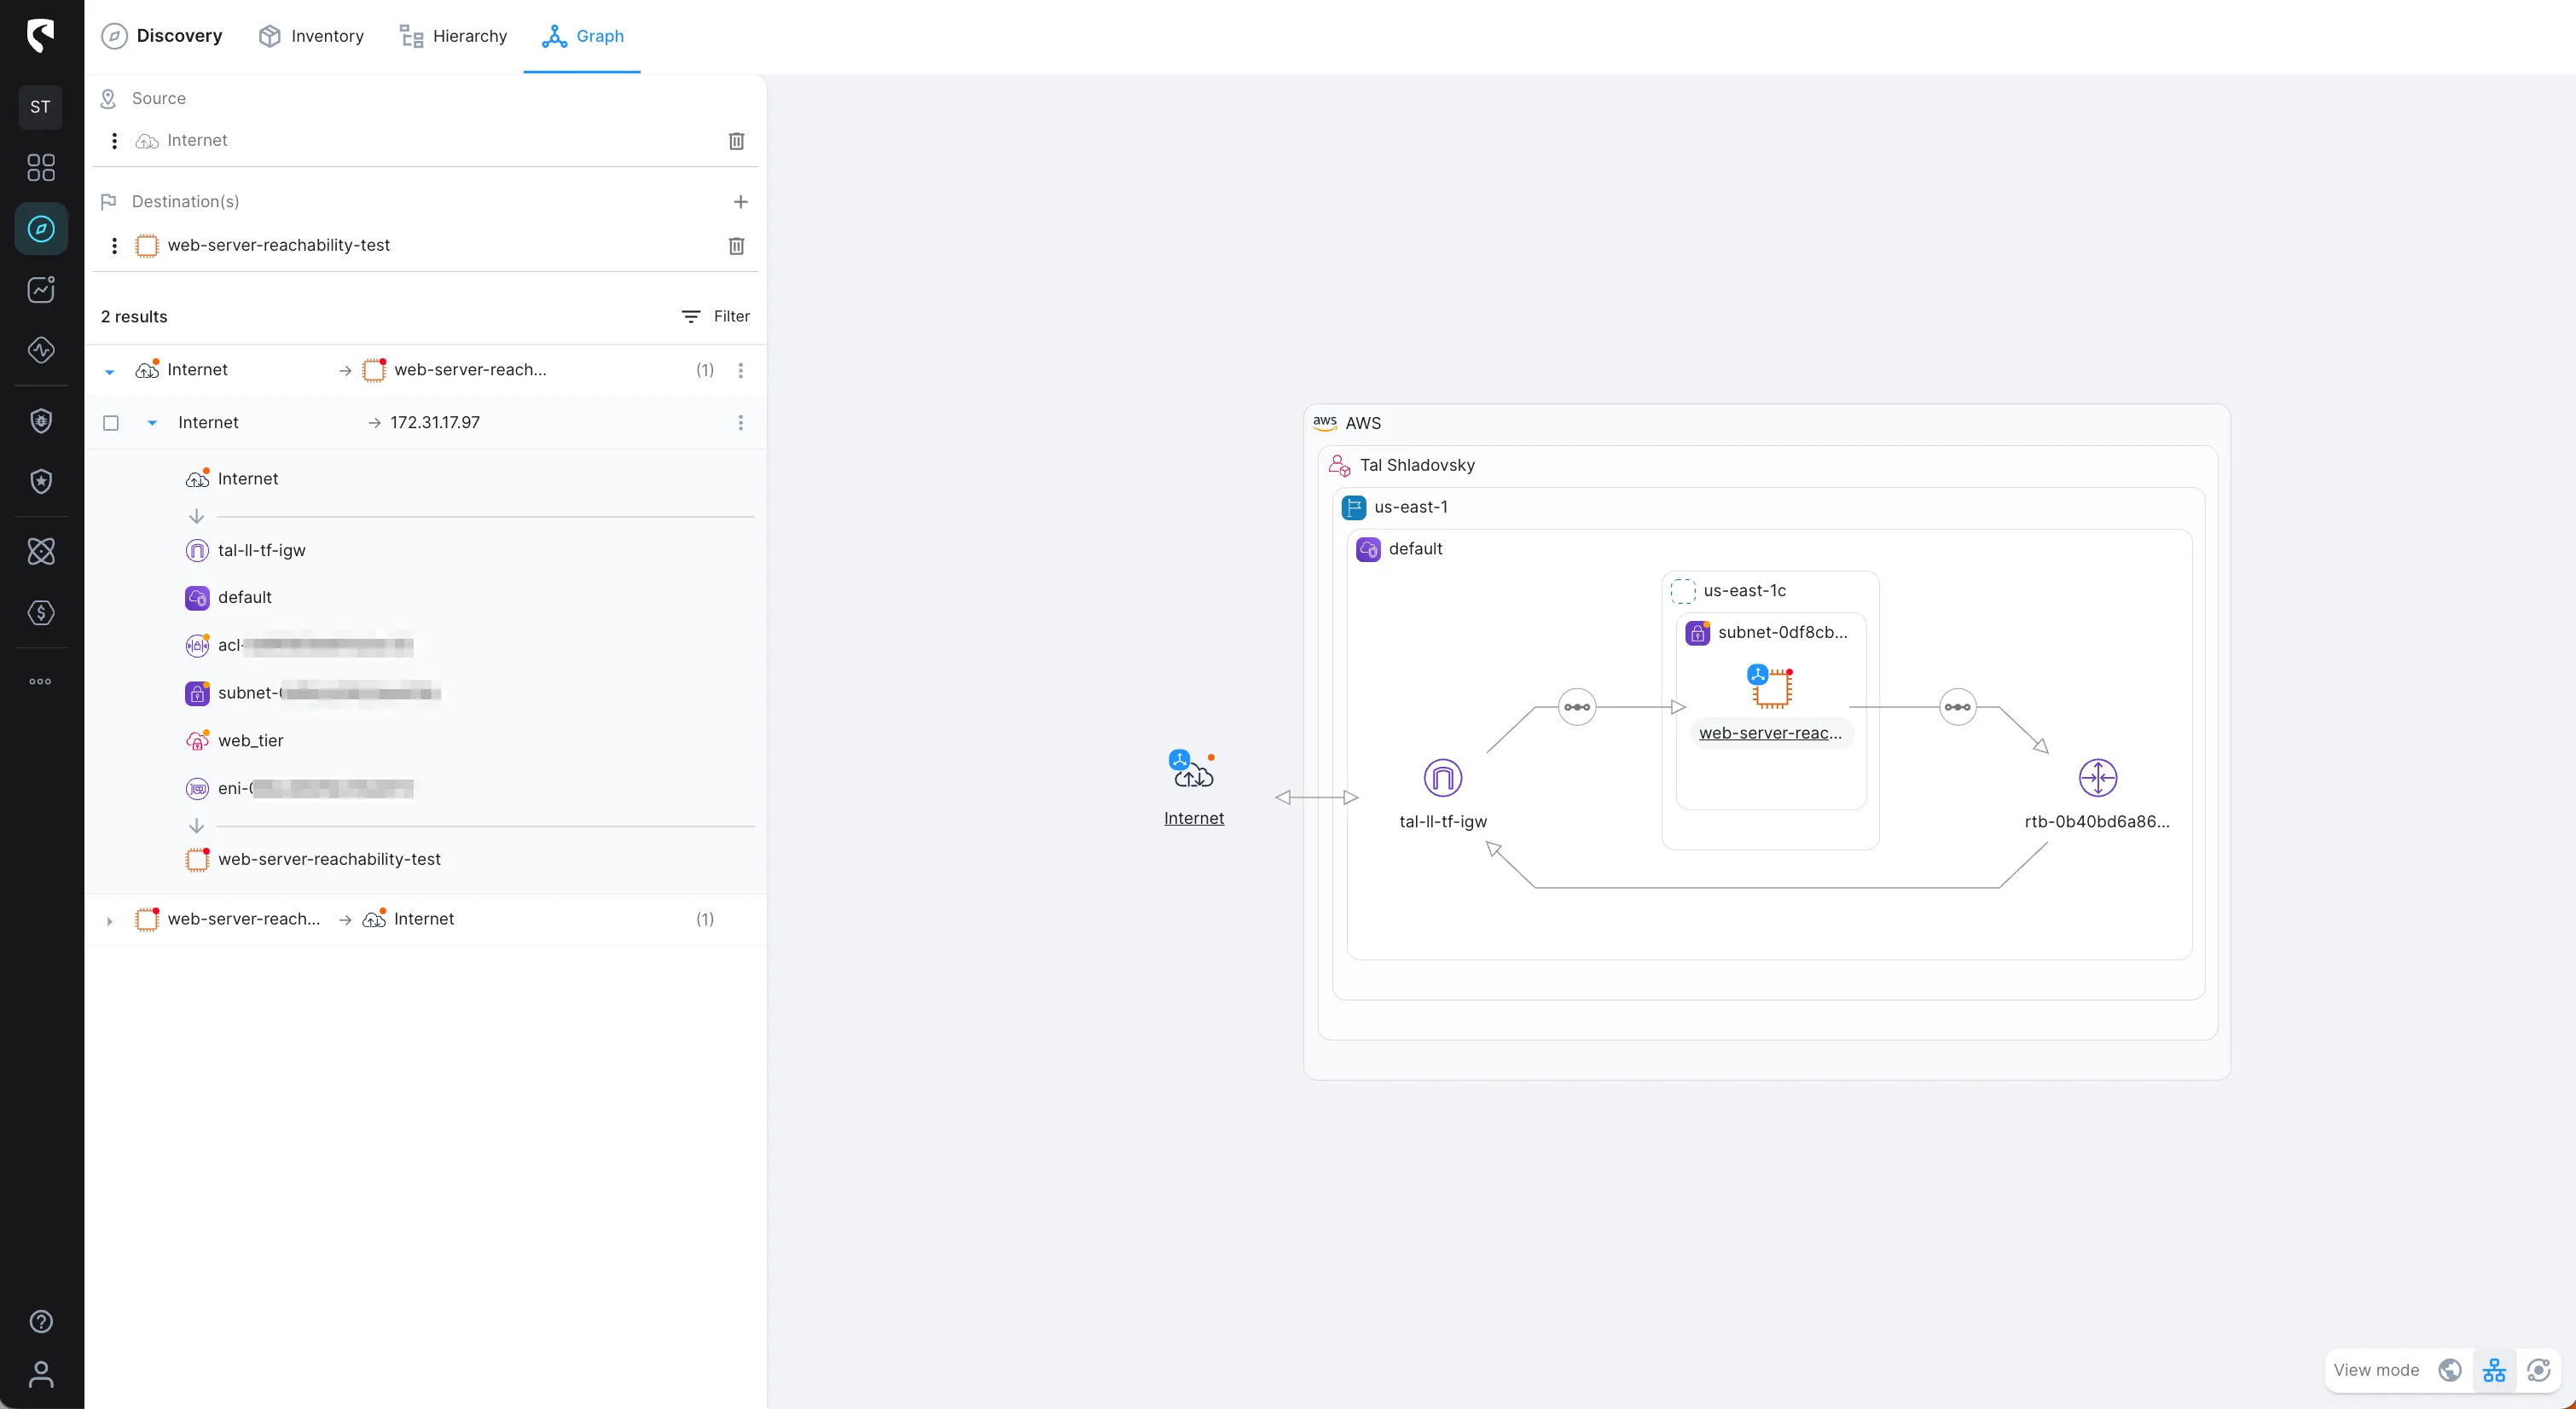
Earlier, I mentioned that the common reason for a REJECT traffic would result in a Security Group, So, let’s inspect it through the visualized view of the network path from the Internet to our web server, and get the full context:
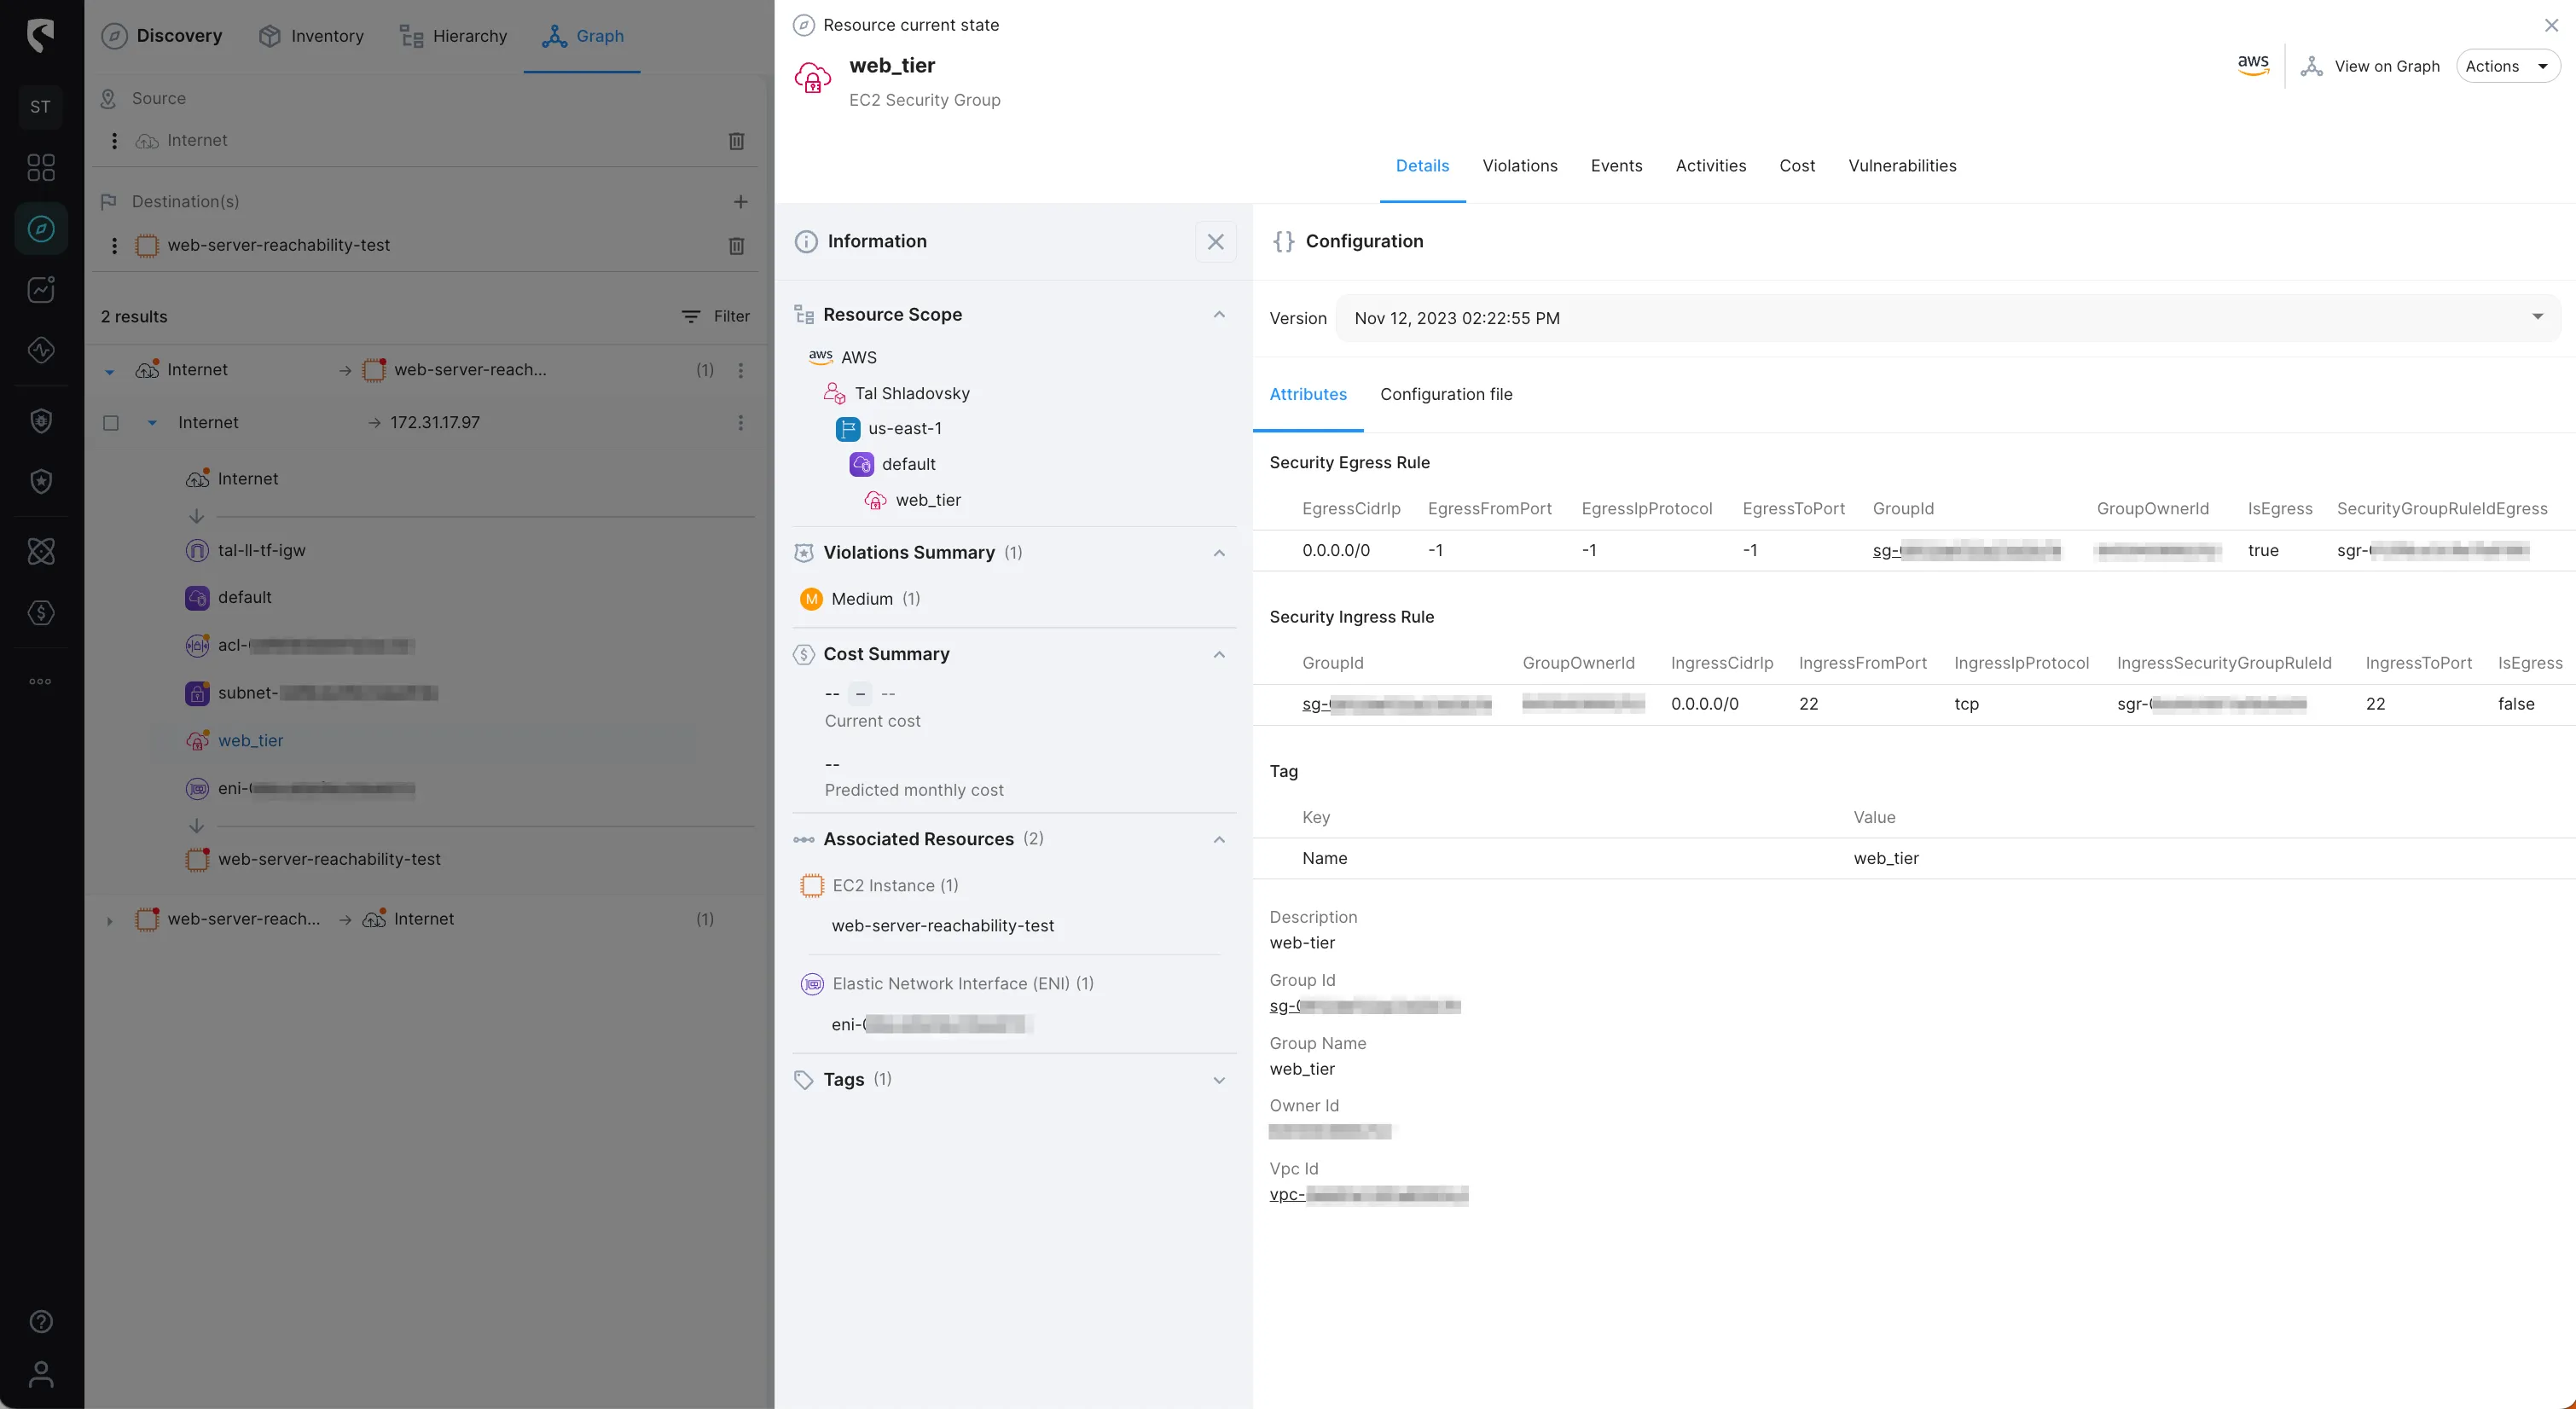
We can review the current configuration of our web server security group, and see that the ingress rule does NOT allow HTTP (port 80) traffic:
We noticed earlier that HTTP traffic was accepted as some point and then turned to rejected. Let’s investigate through the Events to see what happened:
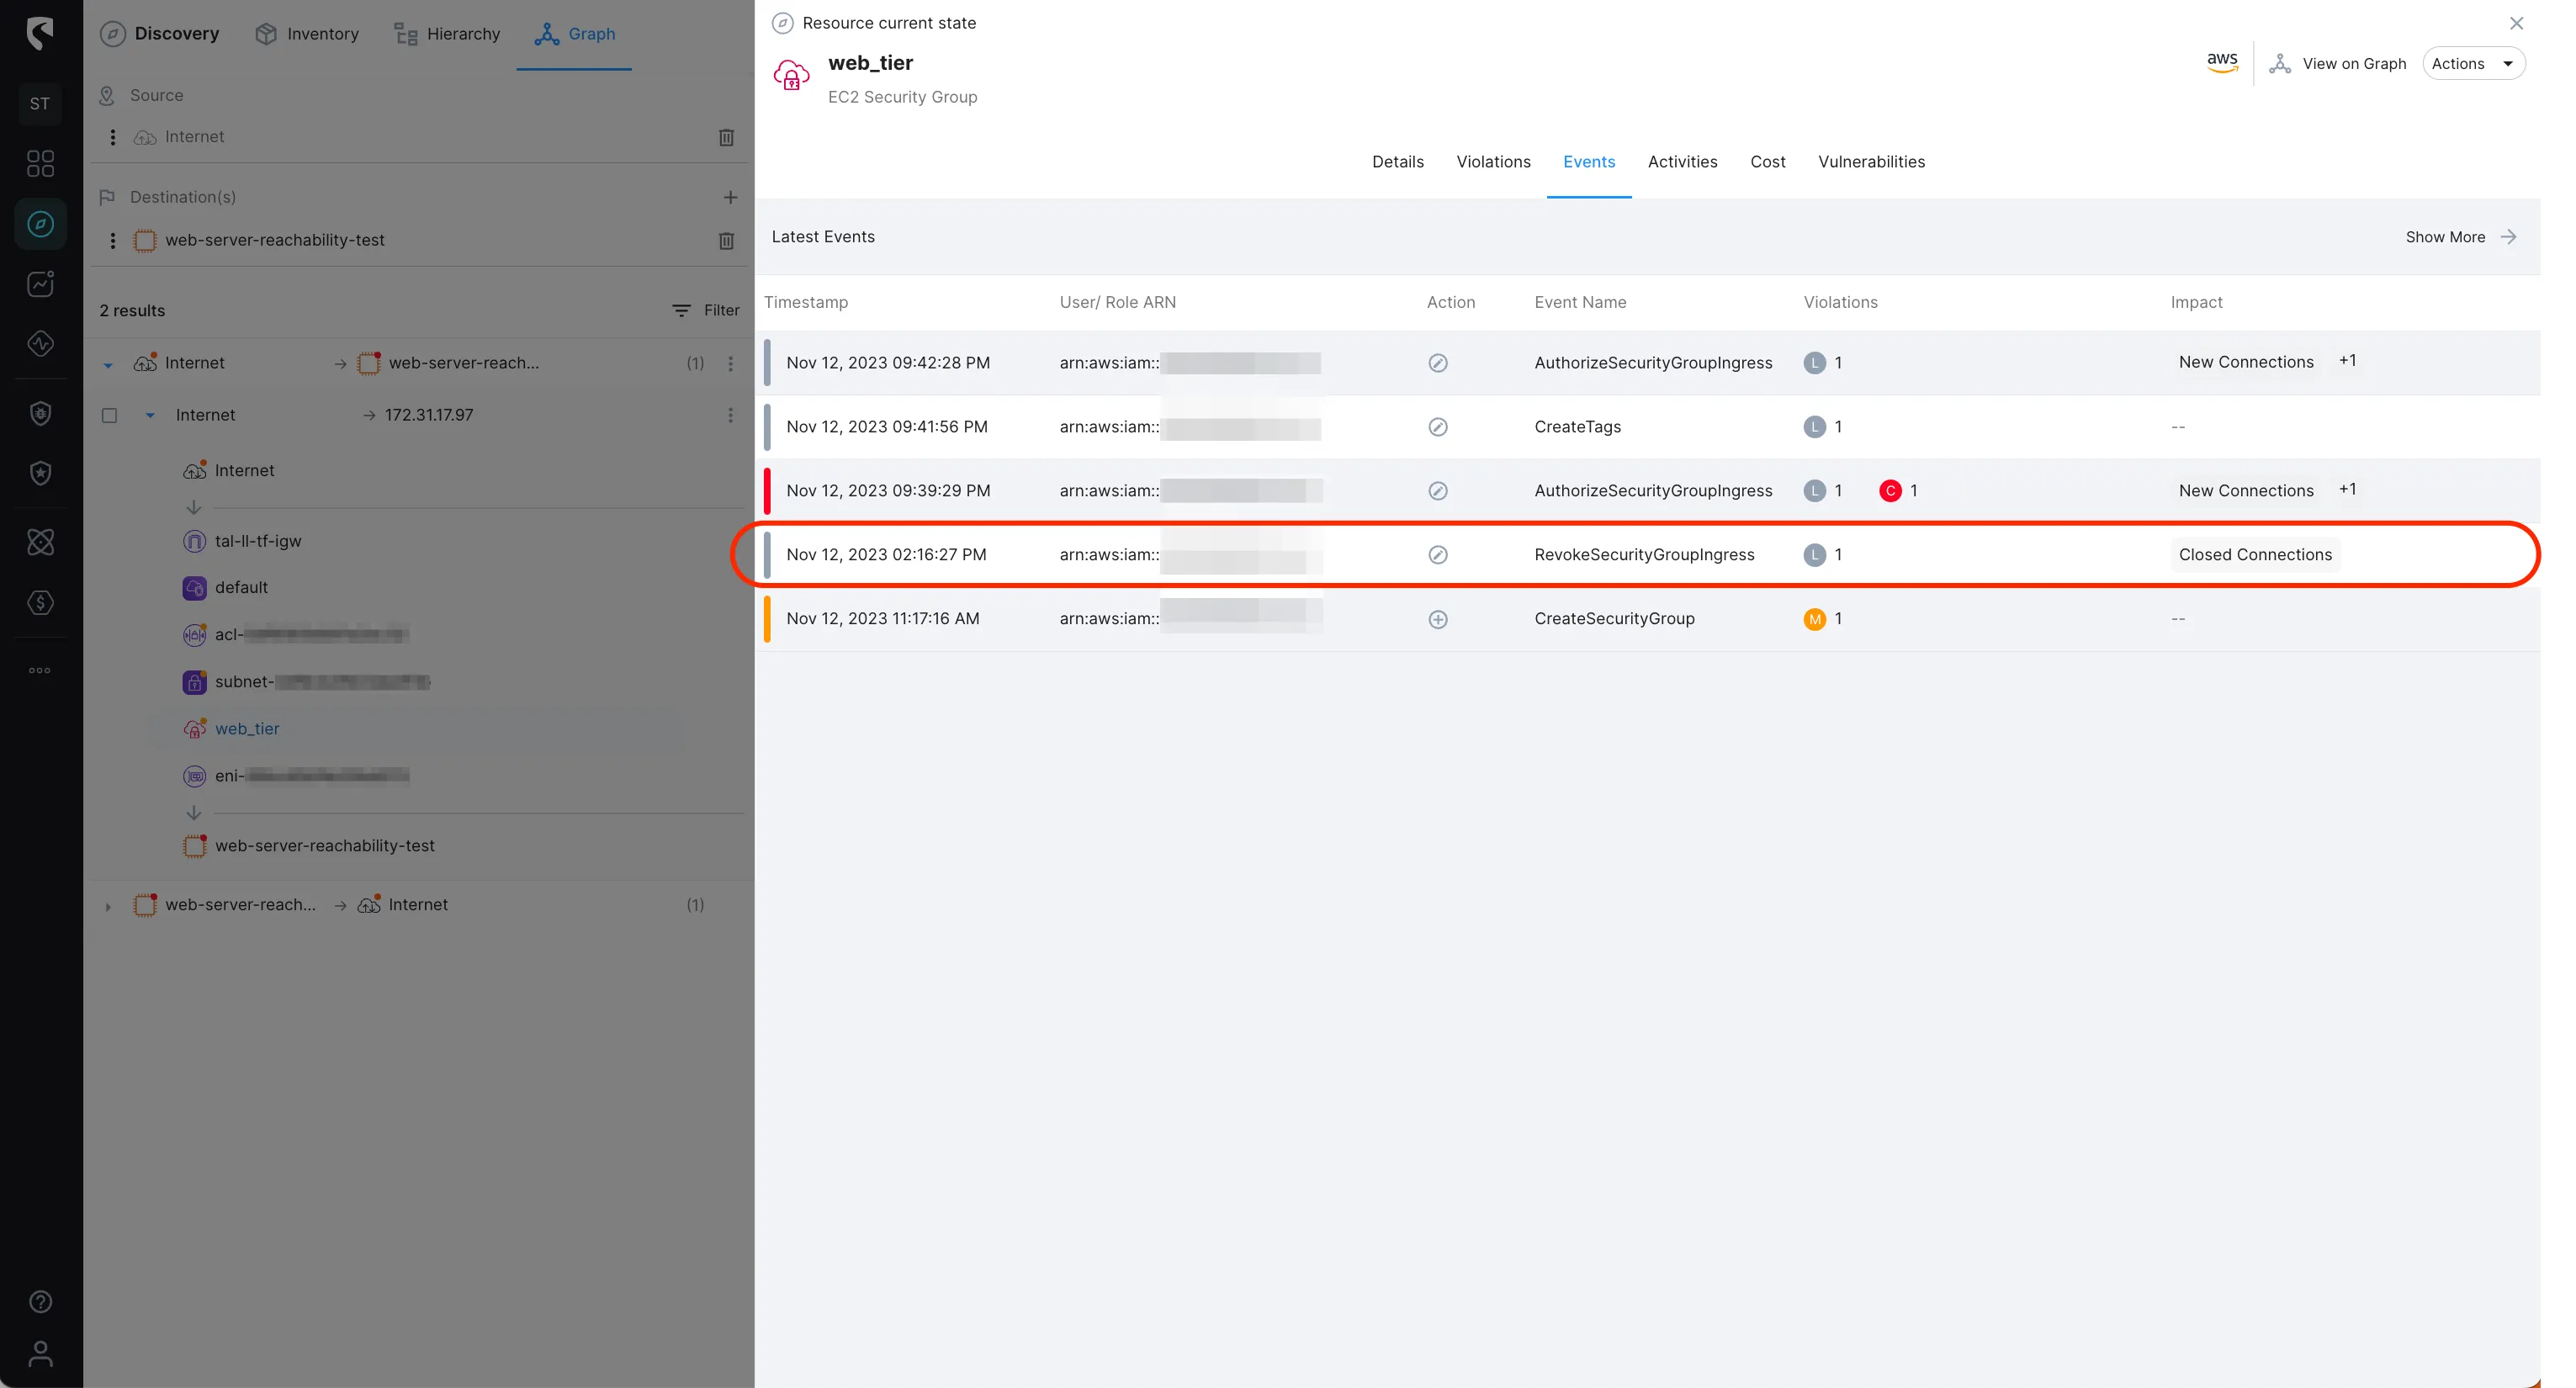
We can see that an event of ‘RevokeSecurityGroupIngress’ was initiated on the security group. Drilling down to the event configuration change, we can see that an ingress rule allowing HTTP (port 80) traffic was removed.

Now, we that we know what caused our web server networking issue, we can easily fix it :)
VPC flow logs capture all the metadata about your traffic and can do so at the network interface level, the subnet level or the whole VPC level. This metadata can be streamed to Cloudwatch logs amongst other destinations and help you understand the traffic patterns on your network. Additionally, they capture information as to whether the packets were successfully delivered or blocked along the way which is an invaluable tool in narrowing down network issues.
Stream Security is an AI Detection & Response (AI DR) company built for the era of AI-driven environments across cloud, on-prem, and SaaS. As AI agents operate with real permissions and attackers move at machine speed, Stream enables security teams to keep pace by continuously computing a real-time, deterministic model of their entire environment. Powered by its CloudTwin® technology, Stream instantly understands the full impact of every action across identities, permissions, networks, and resources, allowing organizations to detect, prioritize, and safely respond to threats before they propagate. This transforms security from reactive detection into a true control plane for modern infrastructure.


